
Currently, I am developing a simple ticket system with the Skybow Solution Builder in Office 365 after work. With Skybow (almost) everything can be implemented as a low-code solution. But then I wanted to generate an overview of all tickets and their status.
I wanted to visualize this – analogous to Microsoft Planner – as a pie chart or donut. How many tickets are open? How many are closed or have a different status? I wanted to present this information to the user at first glance. In addition, the user should be able to quickly and easily customize the diagram according to his or her own wishes. This requirement also had to be implemented as a no-code or low-code solution.
At this point, I did not get on with development at first, as a JavaScript framework seemed to be the only solution. ChartJs (https://www.chartsJS.org) would surely be the tool of choice, though:
- After the tiring last couple weeks, I did not feel like a lot of coding after work.
- Low-code customizing was no option.
- PowerApps have a sort of control that can do the same.
But wait a minute: Can that be done with PowerApps, too?
Yes, sure 😊.
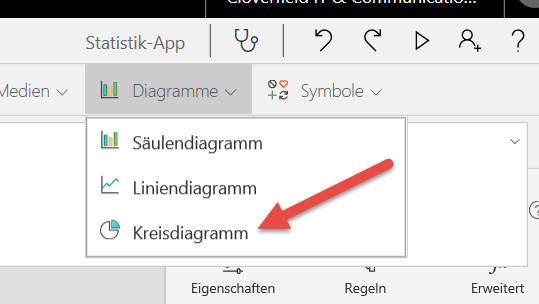
(English screenshots will come later. Hope you can do without for the time being. „Kreisdiagramm“ is a pie chart, for example…)
Pie charts should work. 😊 But can I integrate PowerApps into Skybow Solutions? Yes, of course:
- PowerApps have a web adress.
- SharePoint offers a page viewer WebPart.
- Skybow uses SharePoint.
- And I really did not want to spend more than five minutes for this issue 😉
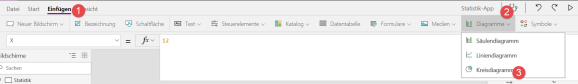
This is how it works:
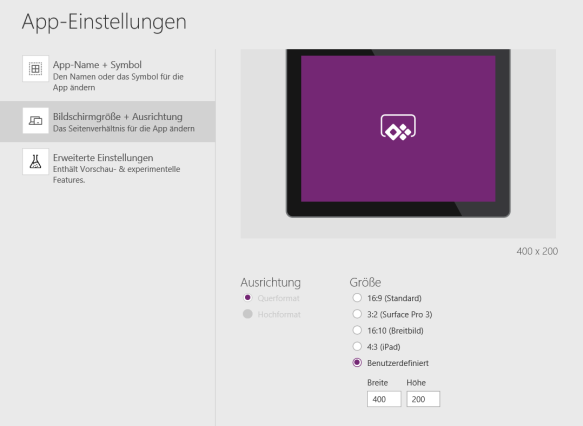
First, we create an app at https://PowerApps.microsoft.com. To make everything easy to read and to fit into the Solution layout, I opted for custom size settings: 400×200 should be fine:
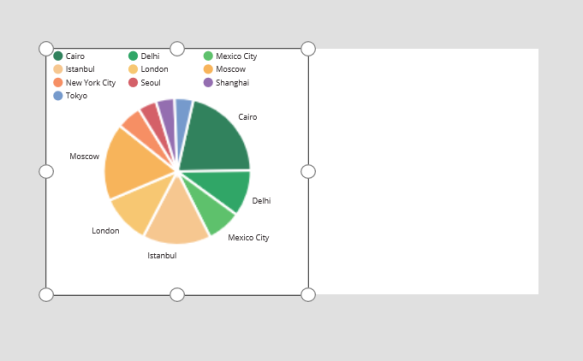
Now, I paste the pie chart in the empty Screen1:
Once the size is customized, the result looks like that:
Getting data on the ticket status by low-code
And now for the data I want to display: I need an overview according to the ticket status. For this purpose, I need to know how many tickets are open, on hold or closed.
To achieve this, I create a collection in the OnVisible event that I want to link to the chart:

The code again:
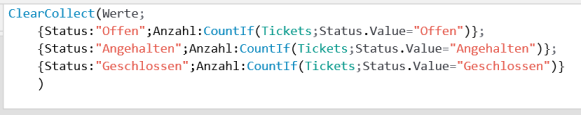
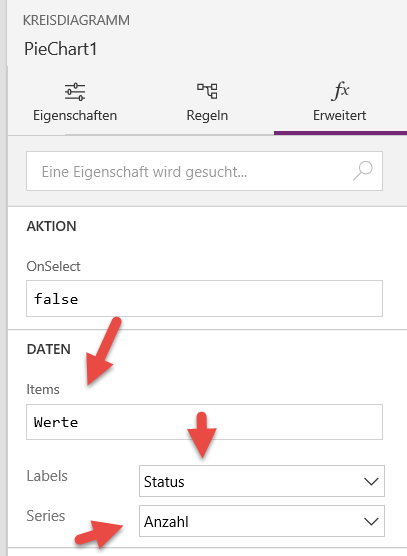
In that way, I get a collection of the numbers of tickets according to their status. And I link this collection to the chart:
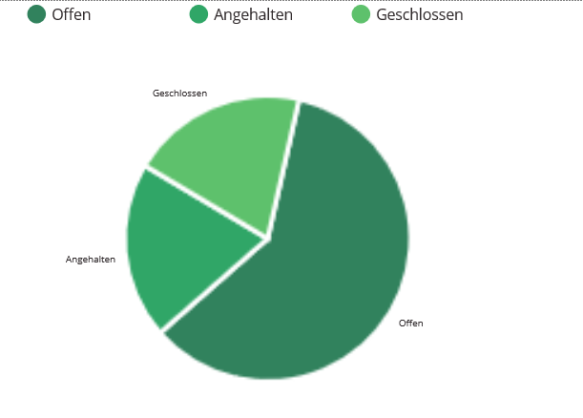
As a result, the chart displays all values:
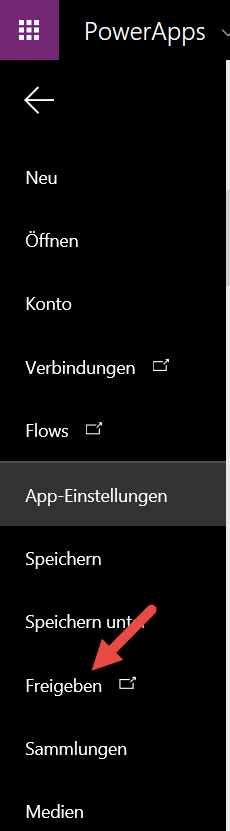
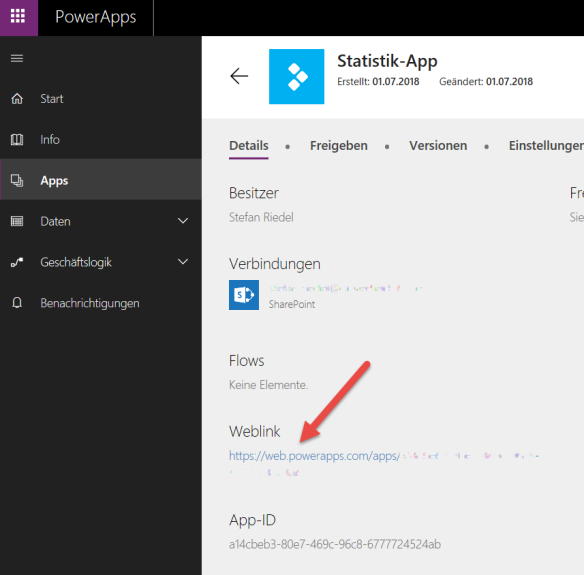
Now I save and publish everything, so that the chart can be integrated into the Skybow Solution. For this purpose, we need the web address of the PowerApp. This can be found in the details when sharing the app:
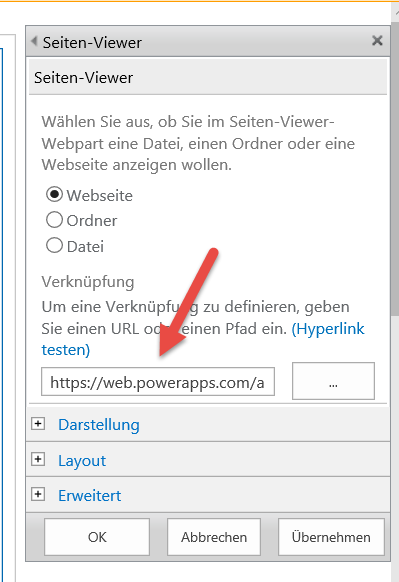
This link must be pasted in the URL field of the settings for the page viewer WebPart. But before, the WebPart needs to be pasted at the desired postiion on the page:

Afterwards, open the WebPart properties and enter the WebLink of the App:
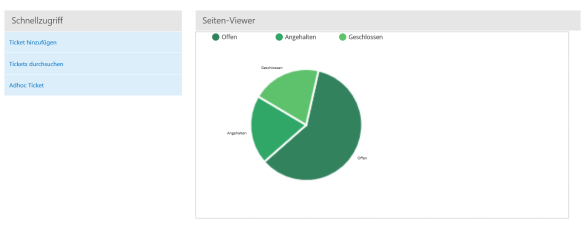
Now, the Skybow Solution is married to the PowerApp, and the desired statistics are displayed:
Other features that would be nice to have
Useful extensions for this solution would be:
- Always up-to-date usin the TimerComponent:
Normally, several users are working with a ticket system. To make sure every user sees the latest status of all tickets in his or her overview, integrating the PowerApps TimerComponent is the way to go. In that way, the chart could be updated every five minutes for example.
- Which chart do you want to see?
Offering a selection of charts would be useful for the user. This could be implemented by re-setting the items property of the chart after every selection in a drop-down or tile menu.
- The whole picture at a glance: statisticsn, burn-down charts & Co.
Darüber Moreover, in many cases the user is looking for information about the overall status of a field of work, about particular projects and team, or cross-area analyses for the leadership. For example:
- How many tickets are processed per day or week?
- How many tickets are closed per day or week?
- How many new tickets were created in a particular period?
- How long does it take before a ticket gets a new status?
- How do all these values develop during the year?
I will deliver answers in the upcoming articles.
Do you have any comments or questions? Feel free to contact me via Twitter @papariedel.
Happy low-coding 😊
P.S.: Of course, these requirements can be fulfilled in SharePoint in other ways, too. But Skybow is my favourite Framework.

Du muss angemeldet sein, um einen Kommentar zu veröffentlichen.